# Kubernetes 指标收集拓扑
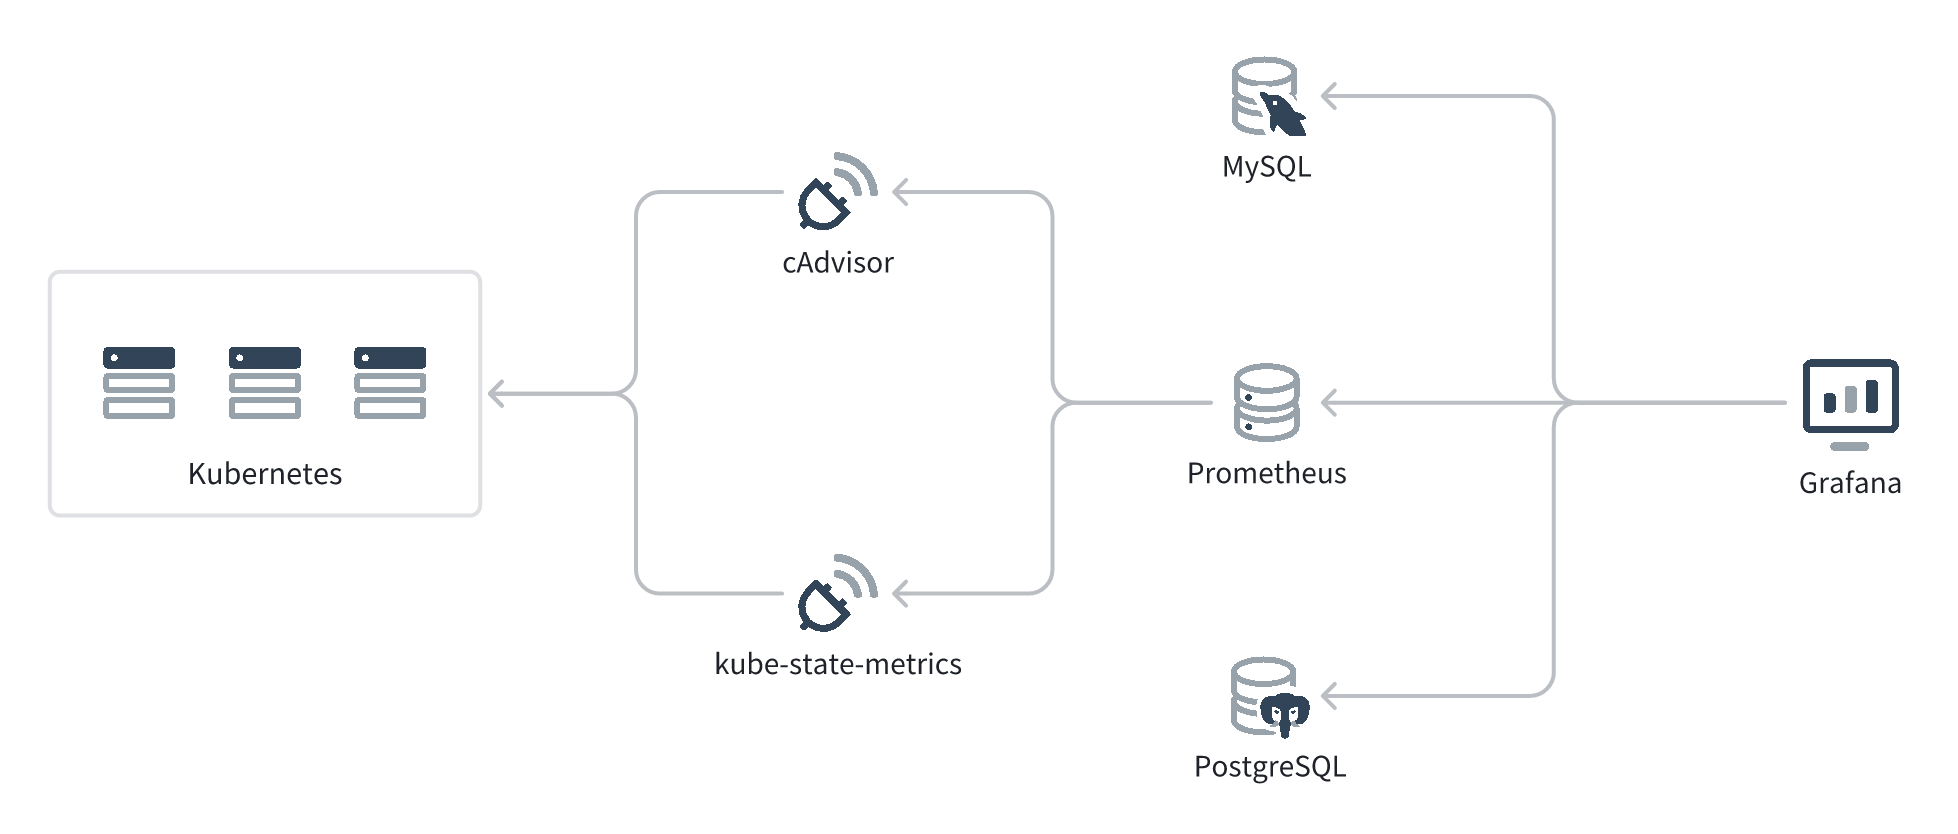
上图是 Grafana 收集 Kubernetes 指标的拓扑图。
- cAdvisor (opens new window) 和 kube-state-metrics (opens new window) 会作为 Kubernetes Daemonset 运行在 Kubernetes 的每个 Node 上,通过 Kubernetes API 收集 Node、Pod 等的实时指标,然后转换成 Prometheus 能理解的数据结构,通过 HTTP API 暴露出来。cAdvisor 和 kube-state-metrics 收集的数据有一些互补,所以推荐两个都部署。
- Prometheus 会定时拉取 cAdvisor 和 kube-state-metrics 的数据,然后存储到自己的时间序列数据库中。
- Grafana 不会持久化 metric 数据,而是持久化图表的配置,然后通过 PromQL 从 Prometheus 查询数据、展示出来。Grafana 也支持通过 SQL 和其它查询语法从 MySQL、PostgreSQL 等数据源查询数据。
# Prometheus Graph
Prometheus Graph 是一个 Prometheus Query Playground,在浏览器访问 Prometheus 部署的地址的 /graph 路径就可以看到。
Prometheus 的每条记录格式为:
metric_name{metric_label1=value1, metric_label1=value2, ...} = metric_value
Prometheus 会定时轮询数据源,因此还有一个隐藏的维度:时间戳。可以通过 timestamp(metric > 1) 拿到满足 metric > 1 时的时间序列。
PromQL 的基本查询语法是:
| PromQL | SQL | |
|---|---|---|
| 使用 label 筛选 | metric_name{metric_label1=value1, metric_label2=value2} | SELECT * FROM metric_nameWHERE metric_label1=value1AND metric_label2=value2 |
| 使用 value 筛选 | metric_name{metric_label1=value1} > 1 | SELECT * FROM metric_nameWHERE metric_label1=value1AND value > 1 |
| 聚合 | sum by(metric_label2) (metric_name{metric_label1=value1}) | SELECT metric_label2, sum(value)FROM metric_nameWHERE metric_label1=value1GROUP BY metric_label2 |
此外,可以查询 container_cpu_load_average_10s 来看到这个 metric_name 有哪些 metric_labels。也可以通过 group ({kubernetes_io_hostname="10.240.2.255"}) by (__name__) 来获取哪些 metric_names 有这个 metric_label。
# Grafana 筛选器配置
# 级联查询
位置:Dashboard Detail 页 - Settings - Variables。
Grafana 的筛选器支持级联查询。
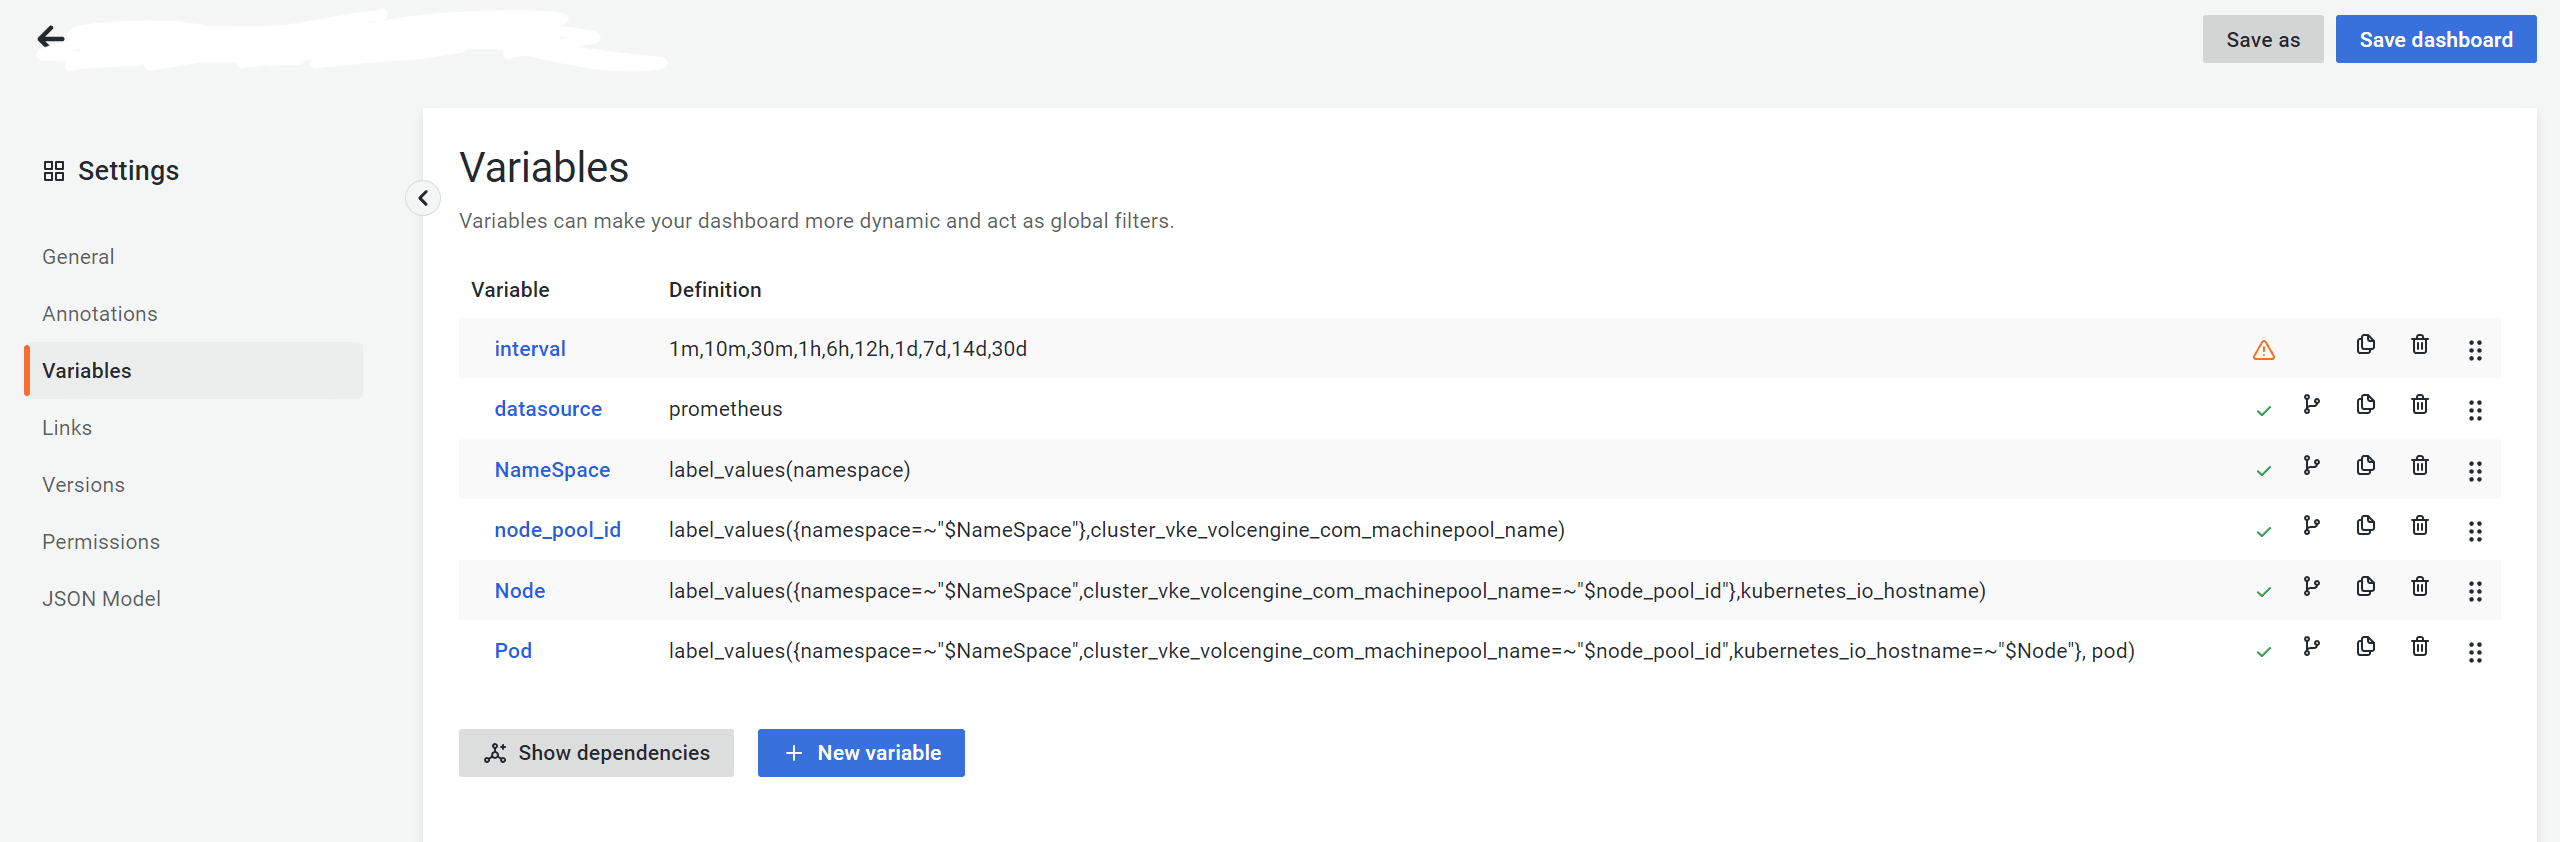
在级联查询中,为了让父项全选(All)、多选(Multi-value)时,子项的筛选仍然能用,小项及 Dashboard 里的数据筛选需要使用 ~=(正则等于)。上图中,node_pool_id、Node、Pod 的 Definition 中均使用了 ~=。
# 级联查询的性能优化
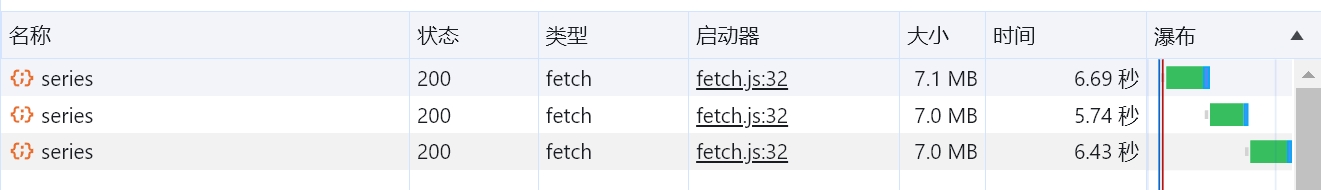
Grafana 虽然支持级联查询,但级联查询的选项需要在前端拉取数据并计算(而非直接由后端返回)。选项更改时,需要进行多次串行的查询。过大的筛选范围和过多的级联查询会降低性能。下图中,不使用筛选器、5分钟内的数据有 ~160M(压缩后 ~7M),三次级联查询耗时共 ~18s。
给筛选器设置默认选项,可以减少每次查询的数据。下图中,筛选 namespace、5分钟内的数据有 ~23M(压缩后 ~1M),三次级联查询耗时共 ~3s。

减少级联查询可以减少需要串行的查询次数。但是需要注意每个级联查询的父项都需要有默认选项,否则对应的级联查询仍需要拉取全量数据。下图中,筛选了 namespace,但在查询不受 namespace 约束的 node_id 选项时,仍需要拉取全量数据。

# Grafana Panel 配置
在 Grafana 筛选器配置了级联筛选时,Grafana 计算子项的选项时会用父项的筛选进行过滤,所以 UI 上的 All 选项,实际查询时会转换为 (option_1|option_2|option_3)。在 Panel 里配置筛选条件时,只需要用正则表达式配置子项的筛选即可,不需要再配置父项的筛选。
metric_xxx{namespace=~"$NameSpace"}
metric_xxx{cluster_vke_volcengine_com_machinepool_name=~"$node_pool_id"}
metric_xxx{kubernetes_io_hostname=~"^$Node$"}
metric_xxx{pod=~"$Pod"}

# no need to add parent filter
metric_xxx{namespace=~"$NameSpace"
           cluster_vke_volcengine_com_machinepool_name=~"$node_pool_id",
           kubernetes_io_hostname=~"^$Node$",
           pod=~"$Pod"}
# Prometheus Kubernetes 常见指标
cAdvisor 的指标以 container_ 和 machine_ 开头,kube-state-metric 的指标以 kube_pod_ 开头。
# Node 资源使用率
CPU Request:
sum(container_spec_cpu_shares{image="",pod!="",kubernetes_io_hostname=~"^$Node$"})/1024CPU Limit(监控意义不大)CPU Usage:
sum (rate(container_cpu_usage_seconds_total{id="/",kubernetes_io_hostname=~"^$Node$"}[1m]))CPU Total:
machine_cpu_cores{kubernetes_io_hostname=~"^$Node$"}Memory Request:
sum(kube_pod_container_resource_requests{resource="memory", node="^$Node$"} * on (container, pod) (kube_pod_container_status_running == 1)) /1024/1024/1024Memory Limit(监控意义不大):sum(container_spec_memory_limit_bytes{kubernetes_io_hostname="^$Node$"}/1024/1024/1024)Memory Usage:
sum(container_memory_working_set_bytes{id="/",kubernetes_io_hostname=~"^$Node$"})Memory Total:
machine_memory_bytes{kubernetes_io_hostname=~"^$Node$"}Storage Usage:
sum (container_fs_usage_bytes{device=~"^/dev/[sv]d[a-z][1-9]$",id="/",kubernetes_io_hostname=~"^$Node$"})Storage Total:
sum(container_fs_limit_bytes{device=~"^/dev/[sv]d[a-z][1-9]$",id="/",kubernetes_io_hostname=~"^$Node$"})
# Pod 资源使用率
CPU Request:
container_spec_cpu_shares{pod=~"$Pod",image=""} / 1024CPU Limit:
container_spec_cpu_quota{pod~="$Pod",image=""}/100000CPU Usage:
rate(container_cpu_usage_seconds_total{pod~="$Pod",image=""}[1m])Memory Request:
sum(kube_pod_container_resource_requests{resource="memory", pod~="$Pod"} * on (container) (kube_pod_container_status_running{pod~="$Pod"} == 1)) / 1024/1024/1024(为了过滤不是运行状态的 pod,使用 join 操作metric_a * on(container) metric_b)Memory Limit:
container_spec_memory_limit_bytes{pod~="$Pod",image=""}/1024/1024/1024Memory Usage:
container_memory_working_set_bytes{pod~="$Pod",image=""}
# Pod 状态监控
- 发生过重启的 pod:
(
    kube_pod_container_status_restarts_total{namespace=~"$NameSpace"} @ ${__to:date:seconds}
    -
    kube_pod_container_status_restarts_total{namespace=~"$NameSpace"} @ ${__from:date:seconds}
) > 0
- Pod 上次重启的时间(此查询性能较差):
last_over_time(
    timestamp(
        increase(kube_pod_container_status_restarts_total{namespace=~"$NameSpace"}[10m]) > 0
    )[$__range:10m] @ ${__to:date:seconds}
)
- Pending 超过半个小时的 pod:
min_over_time(kube_pod_status_phase{phase="Pending", namespace=~"$NameSpace"}[30m:1m]) == 1
$__range 等是 Grafana 变量 (opens new window),[a:b] @ c 是 Prometheus 的 Range Vector Selectors 语法 (opens new window)。这两个语法相当好用,组合起来可以拿到 Grafana 查询范围里的数据向量,并作差、求区间最小值、最后一个有值的时间点(例如基于开机流量计算出查询的时间范围内流出了多少流量、Pod 重启了多少次)。
# Grafana Alert
Alert 条件:Grafana 的 Alert Condition 是:指标超过某范围(如 CPU 占用率超过 80%)。其它场景下需要将指标转化为这种格式(如 pod 出现重启 -> Pod 的重启次数 >= 1)。
Alert 时机:Grafana 会在 Alert Condition 状态(true <-> false)转换时发出警告,即在 false->true 时会发 Firing Alert,true->false 时会发 Resolved Alert。
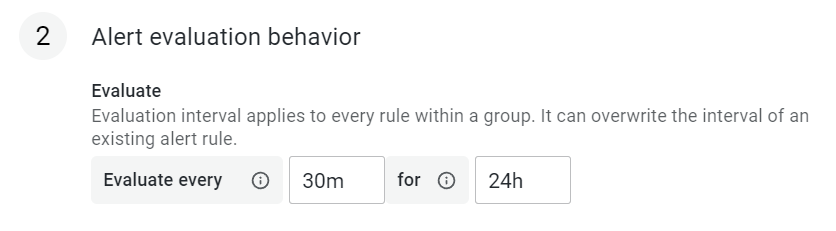
Alert 合并:批量查询的指标(如对不同的 Pod 监控的同一指标),同一时间时变为 true,Grafana 会整合为一条消息发送;Alert 也支持通过配置,将一段时间内的 Alert 合并。下图的配置 evaluation every 30min for 24h 是:每 30 分钟计算一次是否满足 Alert Condition,每 24h 打包发送一次结果。
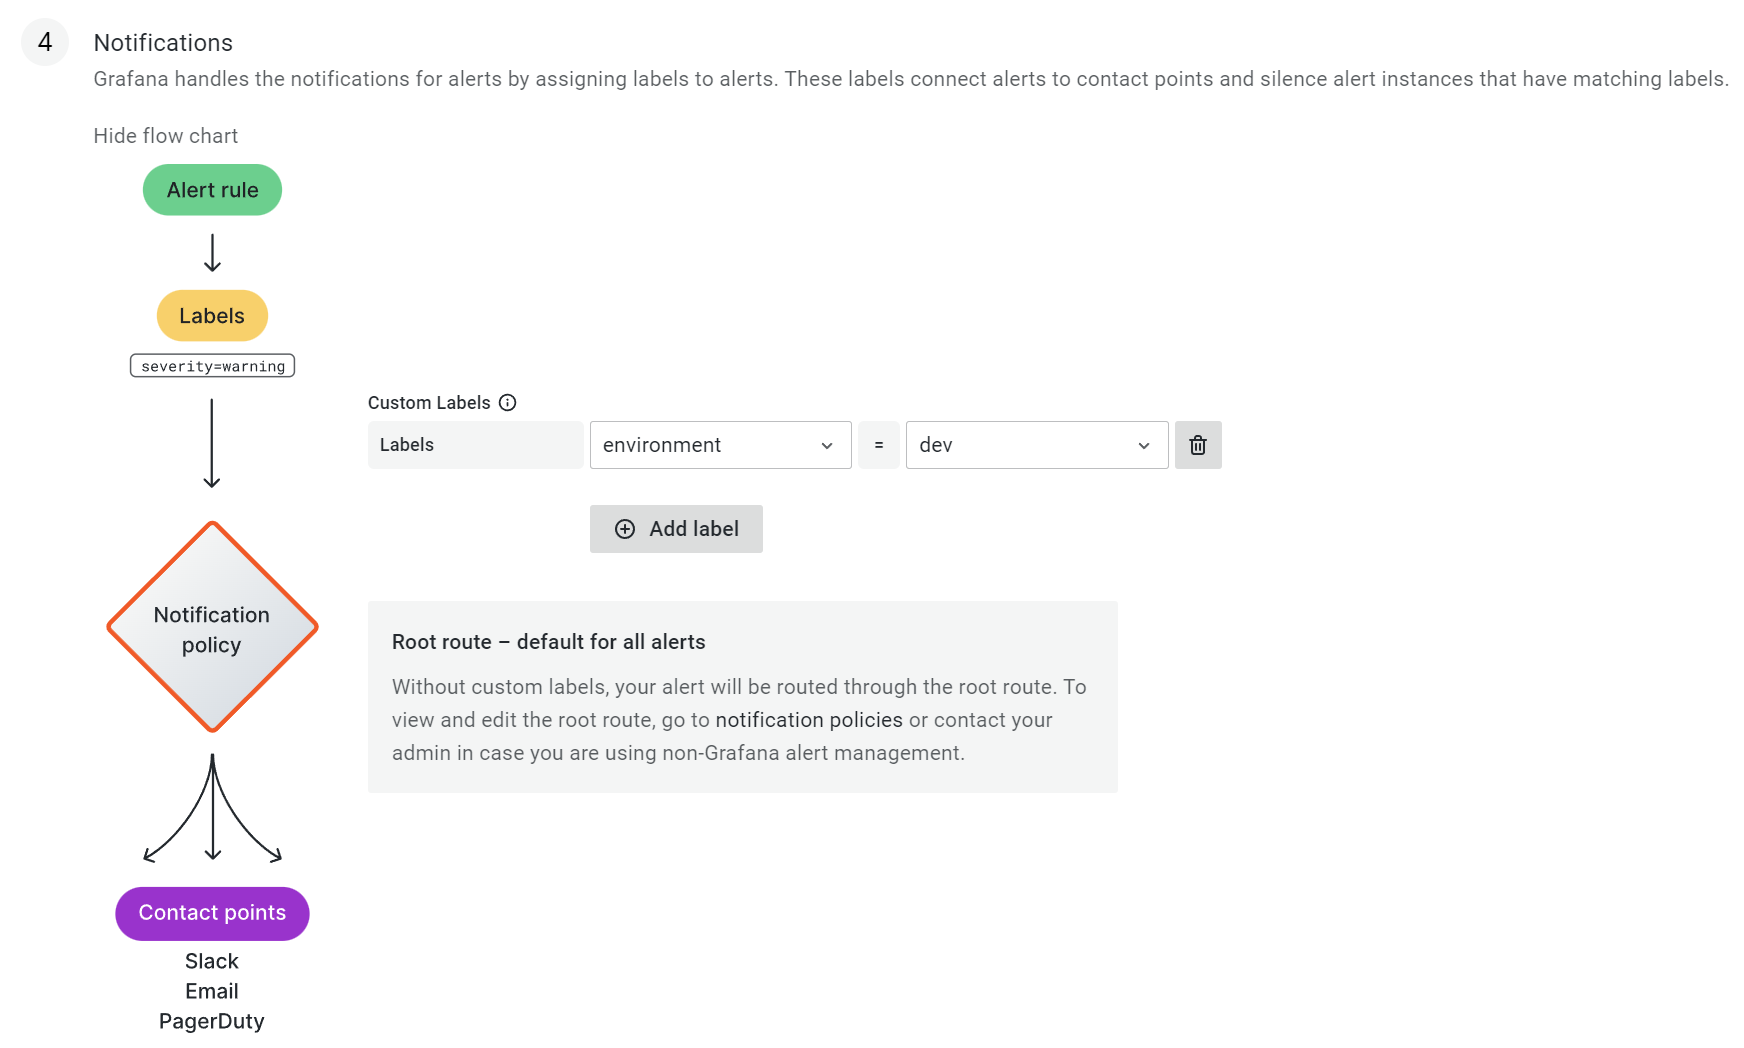
Alert 发送方:Grafana 把 Alert 的条件和发送解耦,不直接在 Alert Rule 里配置发送方,而是在 Alert Rule 里打 label,然后通过 Notification Policy 基于 label 将对应的 Alert Rule 路由给发送方(Contact points)。